


")
Conversion Rate Optimization (CRO) aims to increase the conversion rate using experiments based on quantitative and qualitative data.
Are you getting enough visitors, but would you like those visitors to convert faster, better or more often?
You suspect there’s a bottleneck somewhere, but you don’t know exactly where….
I’m going to teach you how to use conversion optimization to:
- Conduct quantitative and qualitative research
- Discover bottlenecks in your website
- Set up data-driven experiments
Let’s get started…
What is CRO?
CRO stands for Conversion Rate Optimization.
It includes actions you do to increase the conversion rate on your website, this can include the following:
- Quantitative data analysis
- Qualitative customer research
- Experiments
You try to use knowledge of psychology, user experience and web usability to discover friction points in why visitors do not take the desired action. For that, you will set up experiments to solve bottlenecks in a data-driven way:
How to calculate conversion rate?
Calculating the conversion rate is very simple:
Conversion rate = number of conversions / number of visitors
Suppose your website had 10,000 visitors in January and you made 230 purchases, whichmeans you had 230 / 10,000 = 2.3% conversion rate in January.
Why conversion optimization?
You now have 500,000 visitors for a €75,000 advertising budget with 10,000 transactions for €2 million in sales, that is a conversion rate of 2% and an average order value of €150.
Suppose you want to generate a turnover of €4 million next year, you will have to spend at least twice as much advertising budget (i.e., €150,000), increase your conversion rate from 2% to 4% or increase your average order value from €150 to €300.
In general you can’t easily double the average order value, doubling your ad budget is generally not necessarily desirable because of low margins.

Often you see some bottlenecks that cause visitors to take action. Suppose you bring the conversion rate from 2% to 4%, you will have doubled your turnover without extra advertising budget and you will achieve higher margins on your advertising budget so that you can free up more budget for this:

Conversion Optimization Strategy
The Conversion Heuristic Formula:
C = 4M + 3V + 2(I-F) – 2A

- C = Probability of conversion
- M = Motivation of user (when)
- V = Clarity of the value proposition (why)
- I = Incentive to take action (why now)
- F = Friction elements of process
- A = Anxiety about entering information
That means the probability of a conversion depends on the match between the offer and a visitor’s motivation plus the clarity of the value proposition plus (incentive to take action now minus the friction) minus the anxiety.
The numbers next to the abbreviations indicate the importance of the variable.
The goal of the CRO journey is:

- Finding bottlenecks in the current customer journey
- Doing a deep-dive on the bottleneck
- Prioritizing ideas to solve this bottleneck
- Setting up experiments to validate the hypotheses
- Share learnings and implement successful experiments
These steps will then ultimately ensure that the conversion rate is structurally improved.
Conversion optimization and business goals
Conversion Optimization should be the means, not the end….
…It is therefore important that Conversion Optimization contributes to a higher goal.
Strategies can be divided into:
- Company strategy: core values, mission, vision, market, etc.
- Product strategy: positioning, differentiation, segmentation, etc.
- Marketing strategy: messaging, channels, targeting, etc.
Marketing can then be divided into:
- Product Marketing: think product-led growth, or marketing built into the product.
- Performance Marketing: measurable marketing result which is often paid.
- Brand Marketing: less measurable marketing results which can be paid or unpaid.
Growth can be further broken down into:
- Retention (getting someone to buy more often)
- Monetization (getting someone to buy more)
- Acquisition (getting someone to buy)
Ultimately, you can decompose growth so that you know exactly which sub-KPI contributes to which main KPI:

Or like Spotify:

This then allows you to set up a Growth Flywheel, such as Amazon, for example:

Or Booking.com:

Conversion optimization program
Setting up a good Growth Team is no piece of cake, you work at different maturity stages in the process.
There are quite a few different Maturity Models to benchmark yourself against, such as:
Craig Sullivan Optimization Maturity Model:

Waarin je rekening dient te houden met verschillende stakeholders, zoals te zien is in onderstaande RASCI-Matrix:

Of course, it’s good to determine which actions you will implement or evaluate weekly, monthly, quarterly or annually.
Data architecture
Is your organization data mature enough to get started with CRO?
To start optimizing your customer journey and conversion goals, you must first make sure your measurability is in order so you can spot bottlenecks.
Try to add as much measurability as possible in, for example:
- Website (!) quite easily with Google Tag Manager
- Production process
- Delivery process
- Customer satisfaction
- Marketing performance
This also ensures that you can use dashboarding with your organization to gain insight into process efficiency.
See the example of Philips:

CRO Flywheel (7 steps)
The CRO journey is a continuing flywheel in which you can have different objectives:
| Focus | Goal | Strategy |
| Process | Learning to experiment. | Program Strategy, focus on quantity, complexity, experimentation maturity and teams. |
| Customer | Gather customer insights. | Speed, UX quality, referral and sharing rate. |
| Revenue | Bring in winning experiments. | Transactions, AOV, LTV, subscriptions, leads, etc. |
How do you get started with CRO?
- Start with research
Start with quantitative research to discover the bottleneck and expand that with qualitative research to discover why that’s where the bottleneck lies.
- Brainstorm ideas
After you know which bottleneck to solve, you can brainstorm ideas and set up hypotheses.
- Prioritize ideas
After you have a list of potential ideas and hypotheses you can start prioritizing them.
- Start implementing
Calculate the Minimum Detectable Effect and start conducting your experiment.
- Analyze your results
Analyze the results of your experiment, doing deep-dives to gather insights from the experiment.
- Decide what to do
Decide whether to stop, continue or discontinue and determine follow-up actions to move forward on.
- Share the insights
Share the insights with relevant stakeholders so you include the entire company in the experimentation.
1. Research
When it comes to research, within CRO we often talk about the Hierarchy of Evidence, or how reliable evidence is:

Quantitative research – where?
We begin herein with the quantitative research to find out the “Where?” in the bottleneck.
Quantitative research includes numbers and statistics, this can include:
- Digital Analytics: dive into your data to understand the funnel / customer journey. This does require making almost everything measurable, especially to do a deep-dive on a potential bottleneck.
- Mouse Tracking Analysis: watch the mouse behavior of a visitor on the website, the eye follows the mouse.
- Click Heatmap: where do users click? Are they clicking where you want them to click?
- Scroll Heatmap: how far do users scroll? Do they scroll far enough or do you need to start placing elements above the fold?
Example Ecommerce
You see in your funnel a large exit rate (e.g. > 30%) from shopping cart to checkout.
Remarkable, because when someone adds something to their shopping cart and goes to the cart, the motivation is quite high. If that person ultimately does not proceed to checkout, it means that something is not going right in the shopping cart.
Example Lead generation
You see in your funnel a high exit rate on the page to request a quote (e.g. > 95%), after installing form-tracking software you see that happens in the step when filling out the email.
Qualitative research – why?
Qualitative research allows you to find out the “Why?” of a bottleneck.
Qualitative research consists of words and meanings, think of:
| Type | Validity | Cost/Time | |
| Digital Analytics | Quantitative | High | Low |
| Mouse Tracking Analysis | Quantitative | Low | Low |
| Click Heatmap | Quantitative | Medium | Low |
| Scroll Heatmap | Quantitative | Medium | Low |
| Klantgesprekken | Qualitative | Medium | High |
| Vragenlijsten | Qualitative | Medium | Medium |
| Expert Review | Qualitative | Low | Low |
| User Testing | Qualitative | Medium | High |
| Klantenservice Interview | Qualitative | Medium | Low |
| Sales Interview | Qualitative | Medium | Low |
| Live Chat | Qualitative | High | Medium |
| User Recordings | Qualitative | Low | High |
| Review Mining | Qualitative | High | High |
- Customer interviews: engage with your (potential) customers and ask about the answers they give.
- Questionnaires: send existing customers a questionnaire or work with exit-intent and post-purchase surveys.
- Expert Review: with some CRO specialists, evaluate the website in the places where you spotted bottlenecks in the quantitative analysis. Be sure to include the following points in your evaluation:
- Clarity: is everything as clear and straightforward as possible?
- Friction: what causes doubts?
- Anxiety: what are you afraid of?
- Distraction: what distracts you?
- Relevance: does it meet your expectations?
- Trust: do you trust the source?
- Orientation: do you know where to click or where you should go?
- Stimulance: why should you move on to action?
- Security: is it safe here? What if …?
- Convenience: how inconvenient is it going to be?
- Confirmation: did you do the right thing?
- User testing: look with your target audience, give them scenarios and ask them questions at the same time to gain insight into their train of thought.
- Customer service interview: interview customer service to get insight into what are common questions and what people complain about.
- Sales interview: interview sales to find out what wins customers over or what keeps them coming back.
- Live Chat: export messages from live chat to find out what questions people have that they can’t figure out the answers to themselves.
- User Recordings: view user recordings on how users use your website and try to gather insights from their behavior.
- Review Mining: get insights from the reviews your company or competitors get.
Example E-commerce
After activating an exit-intent survey on the shopping cart page, you see that more than 45% of the responses indicate that taking care of return costs causes the high exit in the shopping cart.
Example Lead generation
After a user test you find out that 5 out of 5 people indicate that they do not want to leave their email address because they are afraid of being endlessly spammed with
2. Ideation
After knowing where the bottleneck is and why the bottleneck is there, it is time to start brainstorming ideas and creating hypotheses.
Ideas can fall into several categories of the BOOM framework:
- Ability: if you want to get people to do something, make it easy.
- Attention: your visitor’s attention can only be on one thing at a time, lead the eye where you want it to be.
- Motivation: making your product or service connect convincingly with the customer’s needs to increase motivation.
- Certainty: people who are uncertain don’t buy, they procrastinate. Make sure you remove uncertainty so people take action.
- Choice Architecture: buying behavior is influenced by how options are presented to us.
The most powerful ideas are often based on a psychological effect or cognitive bias.
In addition, ideas can also have different sizes:

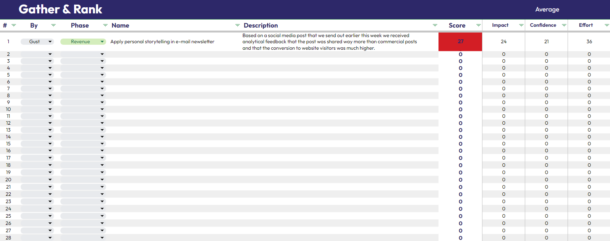
Make sure you turn your ideas into hypotheses so you can start validating them:
Based on [data], we see that [insight]. I expect that if we do [action] that we measure an [increase/decrease] in [quantity] on [kpi] because [reason].
Download the Experiment Canvas to document your ideas:
Example E-commerce
Based on the exit-intent survey, we see that users are not making a purchase because of return costs. I expect that if we start offering free returns we are going to see a +15% increase in the number of transactions versus a +5% increase in returns because we are removing uncertainty.
Example Lead generationBased on user testing, we noticed that users do not want to provide an email address because they are afraid of receiving an infinite number of newsletters. We expect that if we explicitly state that users will receive only one email with the offer and no further follow-up that we will thus see a +20% increase in the number of offer requests, because we remove fear.
3. Prioritization
Prioritization can be done in many ways, some well-known ones are:
- PXL: – for conversion optimization, PXL is one of the most comprehensive prioritization frameworks.

- P.I.E. – one of the most simple and well-known.
- Potential: how much impact can you make?
- Importance: how valuable is the element?
- Ease: how difficult is it going to be to test or implement?
- I.C.E. – similar to P.I.E. and therefore also quite simple.
- Impact – how much impact is it going to have?
- Confidence – how confident are you that it’s going to work?
- Ease – how easy is it going to be to implement?
In addition, it can help tremendously to do a power analysis. That is, you’re going to look at the different pages or elements that you want to set up a test for and see how long the test would have to run before you can demonstrate significance.

There are several tools to calculate the MDE.
4. Execution
You start by evaluating whether you have enough data to start testing at all.
This depends on:
- Sample size
- Effect size
- Significance level
There are numerous tools you can use to calculate how long your test should run to demonstrate significance, or Minimum Detectable Effect (MDE).
Also, you don’t have to test everything:

Different types of testing
- A/B Test: a test where variant A and B get the same amount of traffic and where ultimately predefined KPIs are considered to examine which variant works better.
- Multivariate Test (ABn Test): a test where more than 2 variants are tested against each other. ABn testing requires a lot of data to demonstrate significance.
- Fake Door Test: you are not going to design full functionality, but you are going to measure user motivation. For example, you place a button on your website that makes users think there is a certain functionality, if it is clicked often you have validation that there is demand for a certain functionality.
- Multiple Tests: in some cases it is also possible to run multiple tests simultaneously. This is basically only desirable if they are evaluated on different KPIs to avoid data contamination.
- Leap Test: adjusting more than one element in a test. This leaves you with no certainty as to which adjustment triggers the effect, but allows you to move faster with your testing program.
- Bandit Test: maximize revenue, if variant A works better then A is shown more often during the test period and if B works better then B is shown more often.
- User Test: present some users with a particular situation or action to validate assumptions.
5. Analysis
After your test has run, you can start analyzing it.
Sample Ratio Mismatch (SRM)
First, it is good to check if there is a Sample Ratio Mismatch….
That is, there is a mismatch between the number (or type) of users between the different variants.
Ideally, the ratio of an A/B test is 50/50 and an A/B/C test is thus 33/33/33, but with a Sample Ratio Mismatch, users may not be evenly distributed or certain types of users such as new/returning – mobile/desktop users may not be evenly distributed.
You can rule that out using an online calculator.
Frequentist Approach
With the frequentist approach, you try to reject the null hypothesis (A is better than B).
There is also the Bayesian method, but I don’t want to make it more complex for you than it has to be.
You can do that as the Confidence Interval (CI = 1 – P value):
- After 1 week is 99%
- After 2 weeks is 98%
- After 3 weeks is 95%
- After 4 weeks is 90%
Unless you agree otherwise with your company.
The P-value can be calculated using CXL’s A/B test calculator. If you have a positive (> +0.01%) outcome use the one-sided Z-test, because you then ask the question:
- Is A better than B?
If you have a negative (< -0.01%) outcome you use the two-sided Z-test, because then you ask the question:
- Are A and B different in any direction?
Example one-sided
Suppose your test ran for 31 days with 15,000 sessions in each variant with 500 conversions in variant A and 550 conversions in variant B with average order value of $100.00 then you would get a P-value of 0.058 and a Confidence Interval of 1 – 0.058 = 94.2%:

Example two-sided
Suppose you are working with the same data, but variant A had 550 conversions and variant B had only 500 then you would get a Confidence Interval of 1 – 0.12 = 88%. Which is not significant because we should be above 90% after 4 weeks:

For the two-sided method, you need more data than the one-sided method because your query becomes broader.
Two-Sample T-test
In an A/B test you work with percentages, if you want to calculate significance over absolute numbers you can use a Two-Sample T-Test.
You enter your absolute data after which significance over the difference in median of your two data sources is calculated.

The median is the middle value as you rank your dataset from smallest to largest value. The mean is the sum of all values divided by the total number of values.
Errors
There are two types of errors that are common:

- False positive (type 1 error): you think B is better than A, but it is not. The test measures a difference in result between the two variants that is not there.
- False negative (type 2 error): the test shows that B is worse than A, but that is not true. The test did not find a significant result when there is one.
6. Decide
When you have analyzed your test you can have 3 different outcomes:
- No significant effect: this does not mean that your hypothesis or design was bad, but that you could not demonstrate a significant one.
- Significant negative effect: it looks like your experiment has a negative effect versus the original.
- Significant positive effect: this does not mean that if you carry it through you are actually going to see this result, but that there is a high probability that it will have a positive impact.
You can make 3 decisions on that:

- Implement
- Iterate
- Abandon
Business Case
The next steps for your CRO program could be:
- More Budget: higher test velocity, or more a/b testing.
- More Knowledge: higher quality A/B testing to gain insights.
- Less Budget: less A/B testing.
You want to calculate from your significant results what the financial impact was.
You can do that by entering the following formula:
Extra transactions per month X the number of months X the average order value
Optionally, you can also use Guido Jansen’s Yearly Impact Calculator for a reliable financial impact. This includes certain corrections.
It is even more interesting if you can visualize the CROAS (Conversion Return On Agency Spend) on a yearly basis to show the value of CRO.
7. Insights
Create a presentation of the test, the result and the learnings. Share it internally so stakeholders are aware of the results from your testing program and so people learn internally that assumptions are dangerous.
A failed experiment has potentially saved you money and a successful experiment potentially makes you money.
In your experiments, make sure you also deep-dive well into the data to learn how certain segments responded to your experiment so you can extract insights from this.
Your insights ideally also lead to new hypotheses that you can prioritize on your hypothesis list.
Extended CRO Process
The extended CRO Process might look like the following:

Start optimizing…
Now you’re armed with enough knowledge to start optimizing your Customer Journey.
I’m curious, how far along are you with your experimentation program and what’s still holding you back?
Let me know in a comment.
P.S. if you would like additional help you can email me at [email protected]
Frequently Asked Questions
Conversion optimization is the process you employ to increase conversion rates. This can include improving landing pages, texts, design or other elements with data-driven experiments.
In order to increase conversion rates, you must first investigate where (quantitative research) there is a bottleneck and then why that bottleneck is there (qualitative research) after which ideas can be brainstormed that can be tested.
If the conversion rate goes times 2, so will the revenue. Often it is many times more expensive to attract more traffic to the website than to improve the conversion rate.
There is no one answer to this question because it depends on several factors, such as the type of product being sold, the marketing strategy and the target audience. However, a good conversion rate is generally considered to be anything above 1%.
For example, if you see in the data that many people are dropping out of the shopping cart after which you find, using user testing, that people are turning away from non-free returns then you could set up free returns as an experiment to validate whether that removes the bottleneck.
![Business-Driven Marketing (BDM): 8 Steps to Drive Business Impact [+14 Templates]](https://gustdebacker.com/wp-content/uploads/2024/07/Business-Driven-Marketing-BDM.png)
![Automate ~30% of Repetitive Marketing Tasks with AI: 5 Easy Steps [+ 7 Expert Prompts]](https://gustdebacker.com/wp-content/uploads/2024/07/AI-in-Marketing.png)
![Customer Journey Map (2025): How-to & Examples [+ Template]](https://gustdebacker.com/wp-content/uploads/2023/11/Customer-Journey-Map.png)
Quite the generous sharing of both words and materials. The thinking was very
helpful. My key take away was get your shit together and by doing XYZ you will nearly
guarantee that the train will be on the tracks heading in the right direction!
Thank you, Richard!