


The TAM SAM SOM Model helps you map out your market size and let’s you calculate the market share that you want to capture…
You have a product or service but don’t know exactly how to formulate a good go-to-market strategy.
There are dozens of different marketing models out there, but there’s not one that identifies what your target markets will be.
I’m going to explain to you:
- What TAM SAM SOM is
- How to fill in the TAM SAM SOM Canvas
- And how to avoid falling into common mistakes
Let’s get started…
What is TAM SAM SOM?
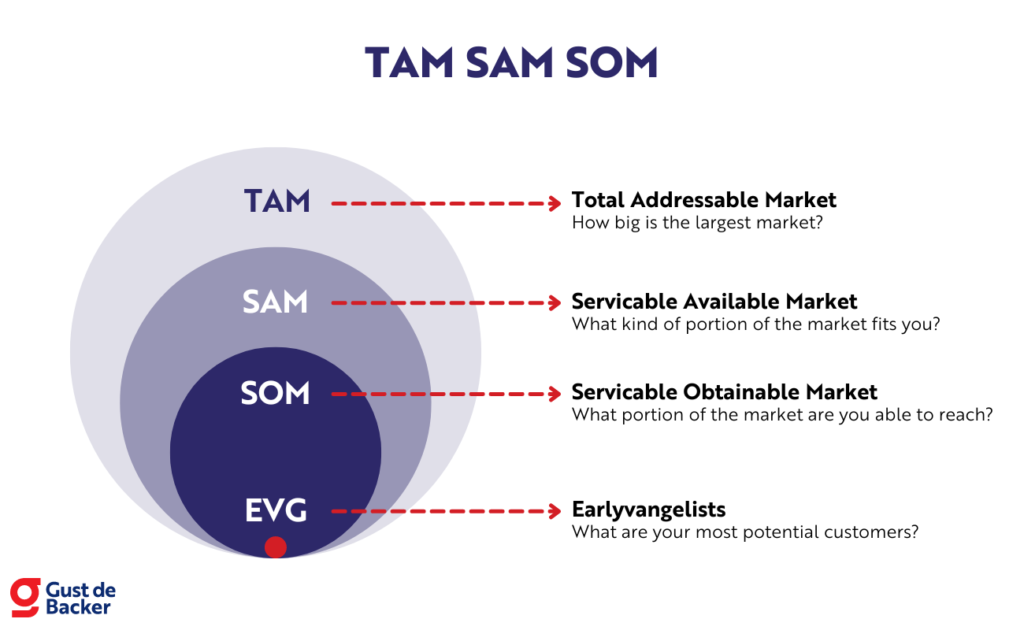
TAM, SAM and SOM are acronyms; they describe different types of markets:
It allows you to break down the entire market you are going to target into “manageable” chunks.
The TAM SAM SOM model is best known by people who want to convince investors that the market they want to conquer is big enough to deliver a high Return on Investment (ROI).
Tip: if you don’t feel like reading this blog you can also watch this video:
But then what are TAM, SAM and SOM…
1. Total Addressable Market (TAM)
How big is the largest market?
The TAM is the total market you could serve with your product or service.
It represents the maximum revenue you could make in the long run if you captured 100% of the market.
A great example of a slide in the Airbnb pitch deck:

2. Serviceable Available Market (SAM)
How big is the market you could reach now
The SAM is a step lower than the TAM, because you are still limited by, for example, the location of your company or the specialization of your company.
SAM is the market that you could actually reach, this will become the market you are going to focus yourself on in the medium term.
3. Serviceable Obtainable Market (SOM)
What is the market you can reach with your current resources?
The SOM can be used to attract the largest possible market in the short term with your current resources.
By resources, think of:
- Staff
- Money
- Brand awareness
- Location
- Competition
So basically everything you have now, what’s available or what you have to deal with.
4. Earlyvangelists
What are your most potential customers?
Officially, this part doesn’t belong there, but we’ll just call it the TAM SAM SOM+ Model…
The earlyvangelists are your most potential customers who can help you get a Problem-Solution Fit and ultimately help you validate whether there is a Product-Market Fit.
You can recognize earlyvangelists by:
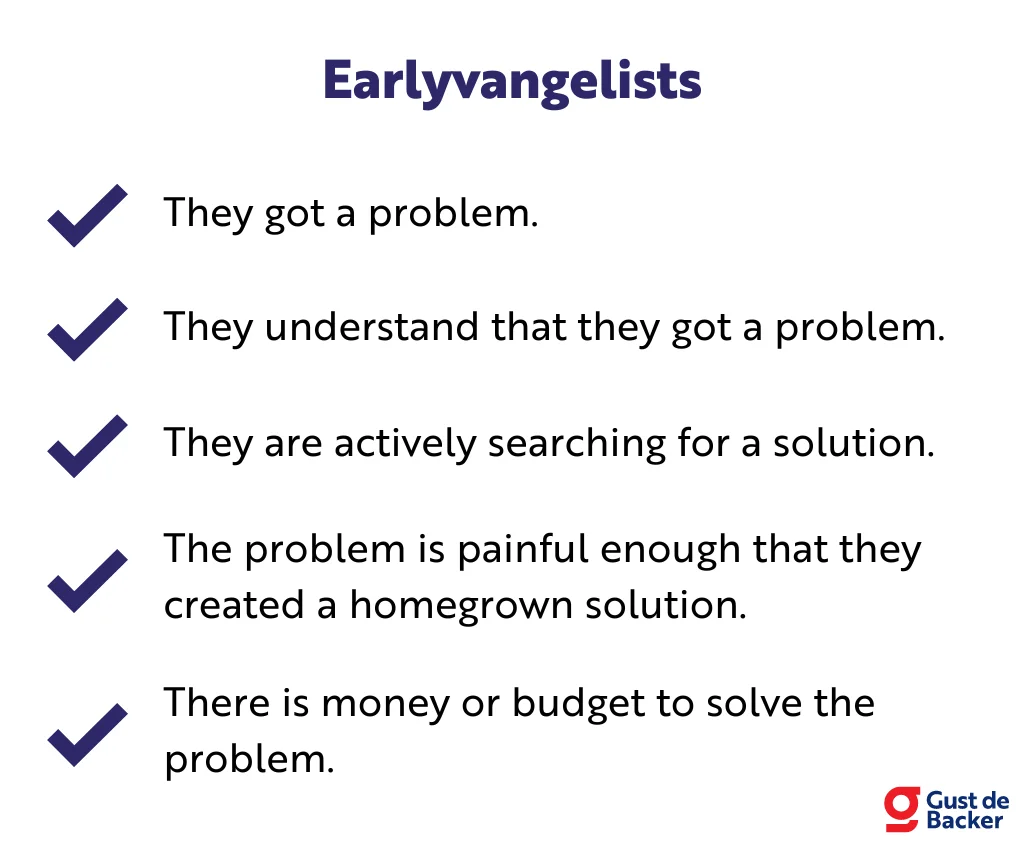
Earlyvangelists are the customers you are going to serve in the very short term to validate your assumptions and business model.
TAM SAM SOM Example
For a fast food restaurant, the Total Addressable Market (TAM) would be the global fast food restaurant market. You can only achieve this if you were located in every country in the world and had absolutely no competition.

It would be more realistic to estimate starting two restaurants in two different cities based on the population and eating habits. So the Serviceable Available Market (SAM) represents the demand for your type of product within your reach. In other words, if you were the only fast food restaurant in town then you have your SAM.
Of course, it’s also still important to consider your competition. You can’t have the entire SAM as a market in this case, because you have competitors as well. With the Serviceable Obtainable Market (SOM), you take into account that you are only going to have people within a certain area of the city as customers.
In this case, the earlyvangelists could be foodies who are always looking for the latest dining options or perhaps people within a 200-meter radius. The earlyvangelists are your very first customers, who you are going to receive the most important feedback from.
ROI calculation
Based on the TAM SAM SOM example, you could say that:
- TAM = €2 billion
- SAM = €100 million
- SOM = €5 million in 2 years and €12 million in 4 years
- Earlyvangelists = the first €250,000 of sales
- EBITDA margin = 25%.
- Exit valuation = 8x EBITDA based on existing business
Assume you get €250,000 investment versus 20% equity. Then at €5 million revenue you would have an EBITDA of €5 million x 25% margin = €1.25 million. At that point your company would be worth 8 x €1.25 million EBITDA = €10 million. The ROI for an investor at that point is (€10 million x 20% ownership) / €250,000 investment = 8.0x
If you reach the target of €12 million the EBITDA is €12 million x 25% margin = €3 million, this makes the company worth 8 x €3 million = €24 million. The investor’s ROI is then (€24 million x 20% ownership) / €250,000 investment = 19.2x
Why use TAM SAM SOM?
The TAM SAM SOM Model has two major advantages:
- You focus on evolving your product or service
- It gives investors a good insight into the potential Return on Investment (ROI)
In addition, I think it is also important to find the right earlyvangelists…
This ensures that in the beginning you only focus on the most potential customers. This will help you get a lot of feedback and doesn’t let you waste time on customers who are not yet satisfied with an incomplete product.
Beachhead strategy
The use of TAM SAM SOM (+) looks a bit like a beachhead strategy…
The beachhead strategy originally comes from the military. The principle involves first conquering a small area after which you can start conquering a larger area.
The small area that you conquer first is called the beachhead:
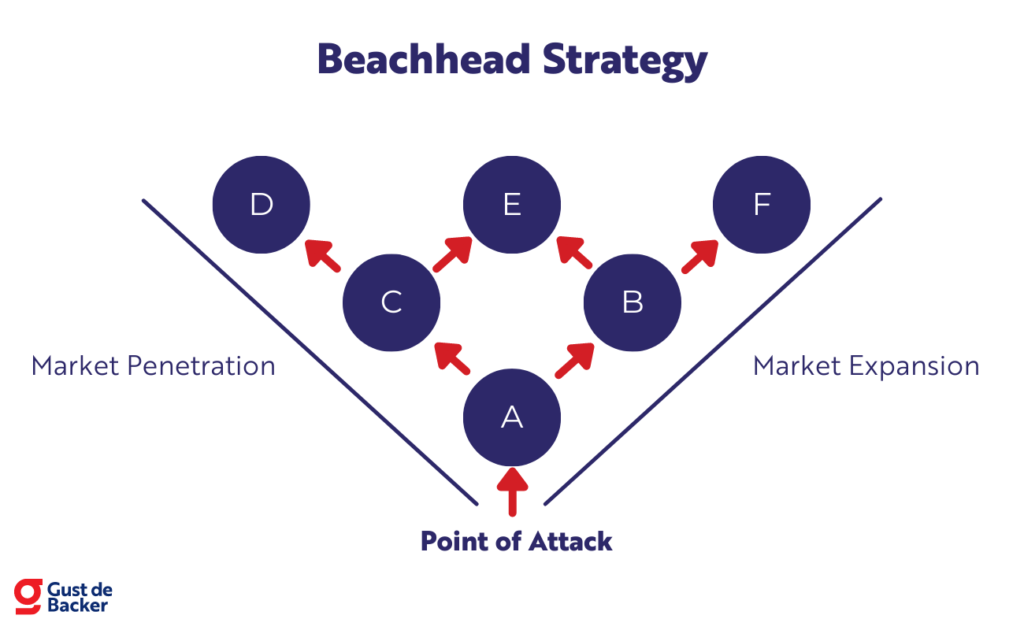
In your business, you can apply this too by focusing your resources on a niche, a small segment of the market. Once you’ve conquered the beachhead (the small segment), you can expand into a larger piece of the market.
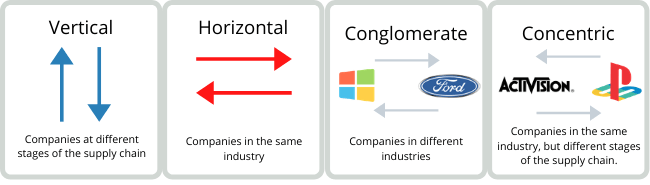
Beachhead acquisition
A beachhead acquisition occurs when a company acquires another company to establish itself in a new geographical location or a new market.
Ease of Growth
To effectively have a beachhead strategy, it is important to look at which target groups it’s easy to grow into:
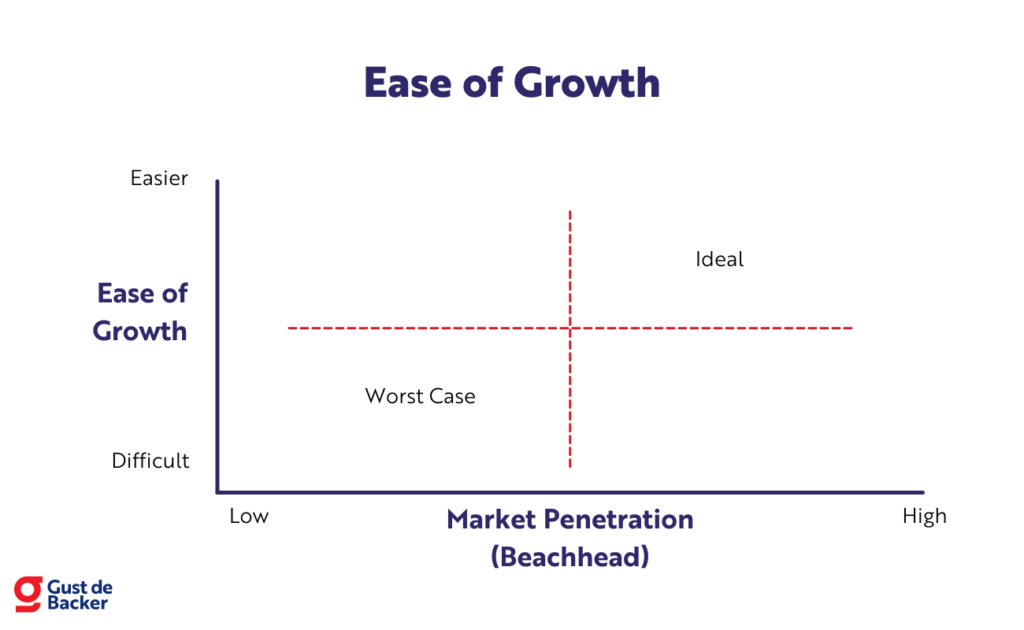
You can check whether it is easy to grow in a particular target market by considering the following specifications:
- How easy is it to sell to them? (decision maker, size of organization, formality)
- Where is the competition? See where the competition is and where they are not. Is there room for your company where they are not (yet)?
- Can you make technical integrations with solutions they are already using?
- Are there regulations that make it easy for you to grow into a market?
‘Crossing the Chasm’
There is an additional challenge involved in bringing a product to market, it’s called ‘The Chasm’.
Your first customers (innovators & early adopters) are quite easy to convince…
They settle for a product that is not yet finished and therefore not perfect:
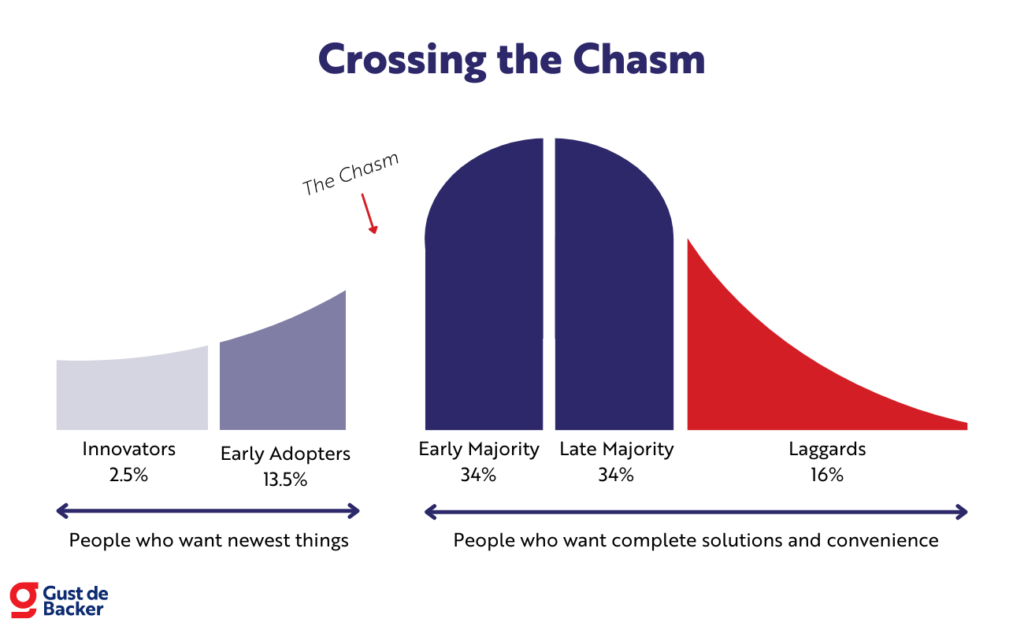
The early majority, late majority, and the laggards on the other hand expect your product or service to be ready to use or deploy.
The gap that lies between the early adopters and the early majority is also known as ‘The Chasm’, here lies a crucial point on whether your company will make it or break it.
You can cross ‘The Chasm’ by:
- Getting lots of feedback quickly from the innovators and early adopters.
- Evolving your product or service in response to feedback, removing as many barriers as possible.
- Assessing which features are indispensable or unnecessary and look for bottlenecks in terms of scalability and make improvements.
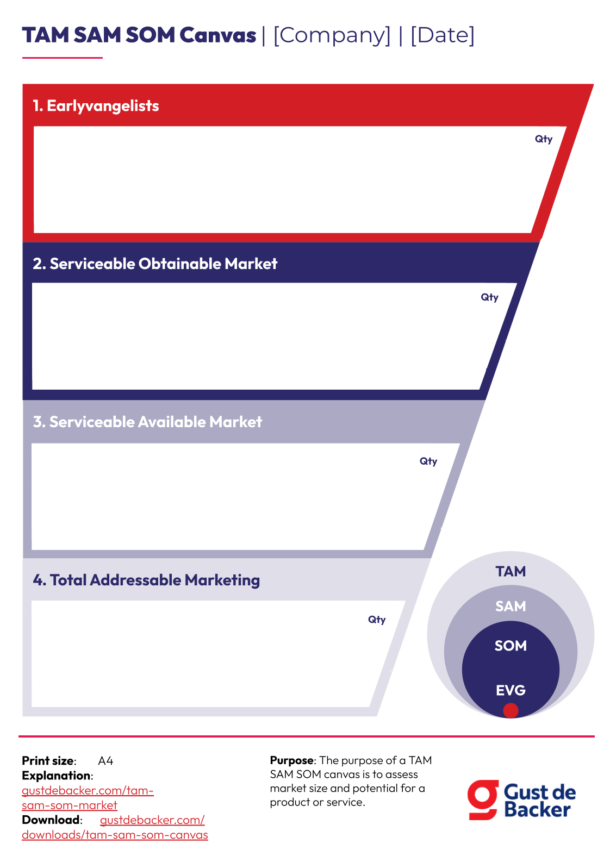
How to fill in the TAM SAM SOM Template?
Download the TAM SAM SOM Canvas so we can fill it out together:
Now look at how to calculate the values of your TAM, SAM & SOM…
How to calculate the markets?
There are 4 different ways you can calculate the values of your market:
- External research: from a statistics firm or a commercial company.
- Top-down approach: go from a mountain of data slowly adding requirements.
- Bottom-up approach: from a detailed amount of data slowly add more data.
- Value Theory approach: find out how much a customer would be willing to pay for your solution (blue ocean).
1. External research
An easy way is to just look at data from a statistics firm or outsource the research…
This can be expensive, butes gives quite accurate numbers. Companies such as:
Can offer very good data (for free). The only downside to this is that you often don’t know how these figures are constructed.
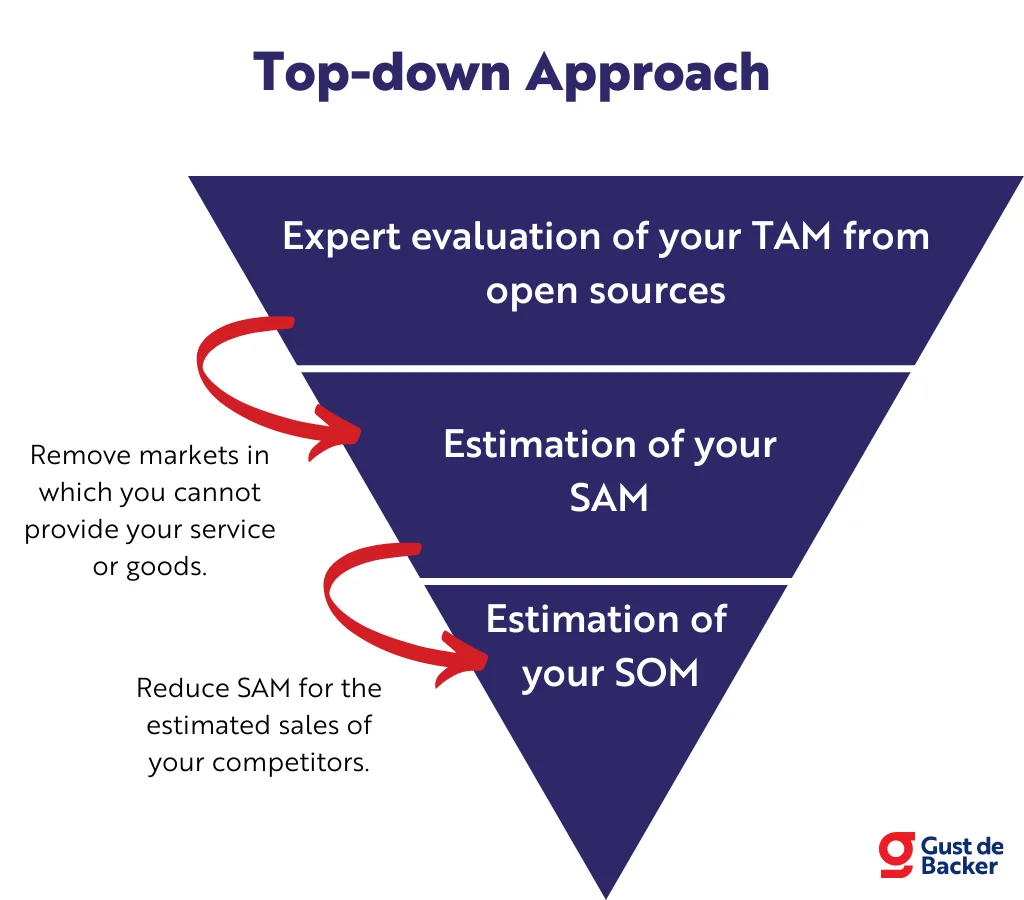
2. Top-down approach
This approach indicates that you are starting from a big mountain of data where you are going to get more and more specific as you start adding more requirements, aspects such as:
- Economic requirements
- Geological requirements
- Sociographic requirements
- Demographic requirements
A visualization of this:
An example from Alex Graham:
The recommended amount of water per day for people is 1.9 liters, there are 7.5 billion people in the world and with the average of €0.32 per liter and a 20% margin, the TAM of bottled water would be the following:
7.5 billion people * 1.9 liters * €0.32 price per liter * 120% margin * 365 days = €2.01 trillion TAM
3. Bottom-up approach
In the bottom-up approach, you start with a proven data point and build on it with new data:
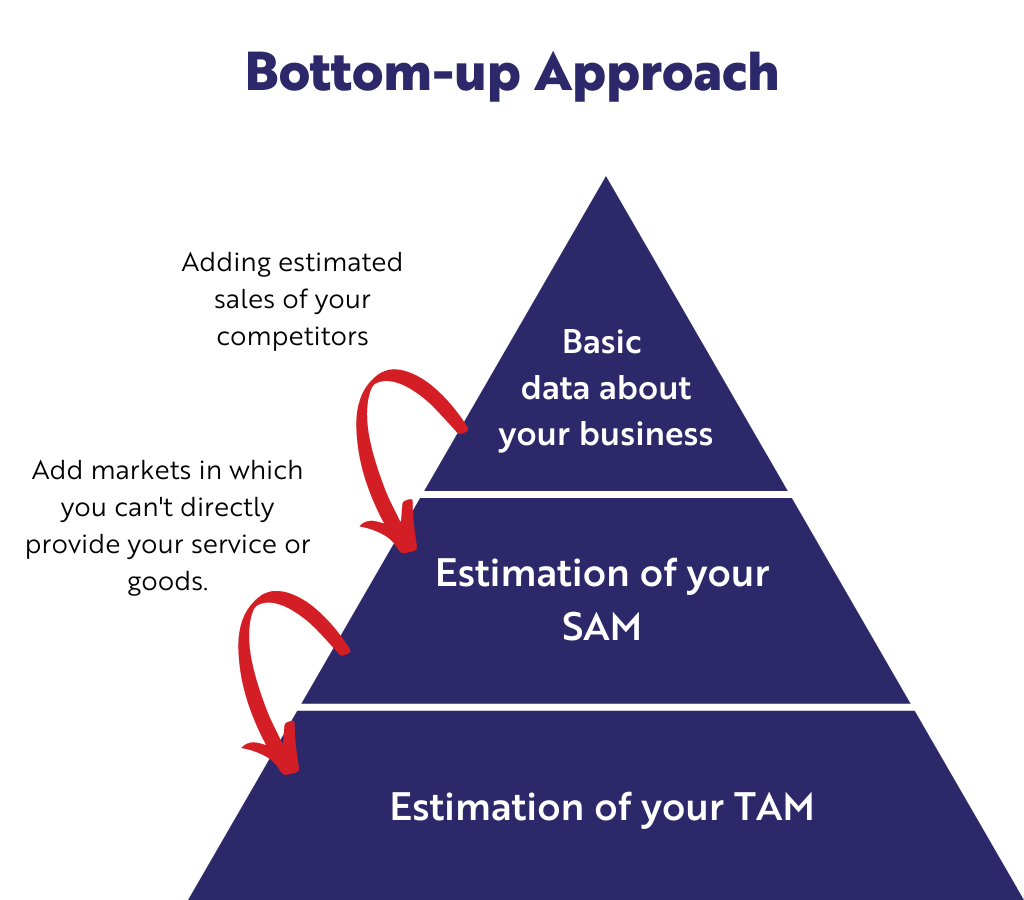
The downside is that many assumptions can create a false image…
Especially at the international level, because there are many (cultural) differences between countries.
4. Value Theory approach
The previous methods are mainly there if you are going into an existing market with an existing product or service…
The Value Theory approach is focused on products or services for which there is not a market (yet).
With this approach, you’re going to look at how much a customer would be willing to pay for your solution. Spotify is a great example of this:
In the time before Spotify, everyone bought CDs, each time they had to pay again.
Spotify released a subscription for €9.99 per month which was very interesting at the time. In retrospect, the market of Spotify would not only include the people who bought CDs, but everyone who listens to music.
Now it’s your turn…
You are now armed with enough knowledge to document your go-to-market strategy…
Now I want to know from you, what do you use to map out your target market(s)?
Let me know in a comment.
P.S. if you would like additional help let me know at [email protected]
Frequently asked questions
TAM, SAM and SOM are acronyms that stand for Total Addressable Market (TAM), Serviceable Available Market (SAM) and Serviceable Obtainable Market (SOM).
TAM SAM SOM is a way to document your go-to-market strategy and convince investors of the Return on Investment (ROI) they can get if you capture the largest market possible.
You can calculate the TAM SAM SOM using the top-down approach, the bottom-up approach, the value theory approach or external research.
TAM stands for Total Addressable Market which describes the revenue your company has when you have captured 100% of your total market with your product or service.
SAM stands for Serviceable Available Market which describes the market you could reach at this moment, including the limitations of your location and business model.
SOM stands for Serviceable Obtainable Market and describes the market you could conquer with the resources you currently have available.
Airbnb’s SOM is the number of trips booked with Airbnb which came down to 10.6 million, Airbnb’s SAM is the number of budget & online trips which came down to 532 million and Airbnb’s TAM is the number of trips booked worldwide which cames down to over 1.9 billion at the time.
This is a good visualization of TAM SAM SOM persona’s:
![BCG Matrix (2026): Meaning and Example [+ Template]](https://gustdebacker.com/wp-content/uploads/2023/11/BCG-Matrix.png)
![Lean Canvas (2026): How-to & Examples [+ Template]](https://gustdebacker.com/wp-content/uploads/2023/11/Lean-Canvas.png)
![Revenue Models (2026): 19 Different Ways to Make Money [B2B & B2C]](https://gustdebacker.com/wp-content/uploads/2023/11/Revenue-Models.png)
whoah this weblog is excellent i like reading your posts.
Stay up the good work! You know, many persons are searching around for this
info, you could aid them greatly.
Thank you, Hong! If I can help you with specific subjects, please let me know.
I need example of tam,sam ,som in food business
Could you send me an email at [email protected]?
Thanks you for insightfull content keep going 👍 and i really appreciate your hard work
Thanks for you comment Raj!
Wow! This blog looks exactly like my old one! It’s on a completely different topic but it has pretty much the same page layout and design. Outstanding choice of colors!
Great to hear! If you have any more questions, feel free to ask them.
Seriously, you hit the nail on the head with these diagrams. Fantastic summary.
Thanks Jason!
If you have any further questions, please let me know!
Dear Gust de Backer,
nice day,
Thank you for the great info you have provided.
May I ask you to explain more about how you calculate ROI in this example?
Regards,
Sama
Hi Sama! What specific element can’t you seem to get a grasp on?
Dear Gust de Backer,
nice day,
I have one more question:
in the top-down method, evaluating TAM and SAM is based on sources available like the World Bank and trade map,etc.
when it comes to SOM I do not know how to estimate it.
is there any approximate percentage of SAM ?
Regards,
Sama
Hi Sama! This is entirely dependent on the quality and abstraction of the data you are able to get your hands on. Maybe it’s not possible in your situation with your resources to have in-depth knowledge about the real size.
This is one of the best and esay-to-understand blog about go-to-market strategy. Thank you.
It will be appreciated if you provide me with an example of using TAM, SAM, and SOM+ for social media platform startup, considering that SAM will be in a specific country.
Thank you for your comment! Here’s a brief example for a social media platform startup:
1. TAM (Total Addressable Market): The global market for all social media users, estimated at 4.2 billion users.
2. SAM (Serviceable Available Market): The social media users in a specific country, say 150 million users in the United States.
3. SOM (Serviceable Obtainable Market): The target market segment within the SAM that the startup aims to capture, such as 10 million young professionals in the US.
This segmentation helps in focusing efforts and resources effectively.
Can you go into the TAM SAM SOM Persona’s spreadsheet shown at the end of the article? Explain how that is completed etc.
The TAM SAM SOM Persona spreadsheet helps in segmenting your market and defining target personas. Here’s how to complete it:
1. Revenue Segments: Define revenue ranges (e.g., $1M-$10M, $10M-$50M, etc.) relevant to your business.
2. Segmentation/Qualification: Identify key characteristics like core tools used, tech attitudes (early adopters vs. late adopters), and geographic focus.
3. Acquisition: Outline value propositions, main pain points/needs, primary acquisition channels, and the purchasing process for each segment.
4. Feature Preferences: List features with high, low, or indifferent preferences for each segment.
5. Pricing: Include price sensitivity ranges, likelihood to buy scores, and discounting needs.
6. Unit Economics: Estimate customer acquisition cost (CAC), lifetime value (LTV), average revenue per user (ARPU), and net promoter score (NPS).
This structured approach helps tailor your strategy to different market segments, optimizing your efforts for each.
A big thank you for your article.Thanks Again. Awesome.